 Discover what moves you
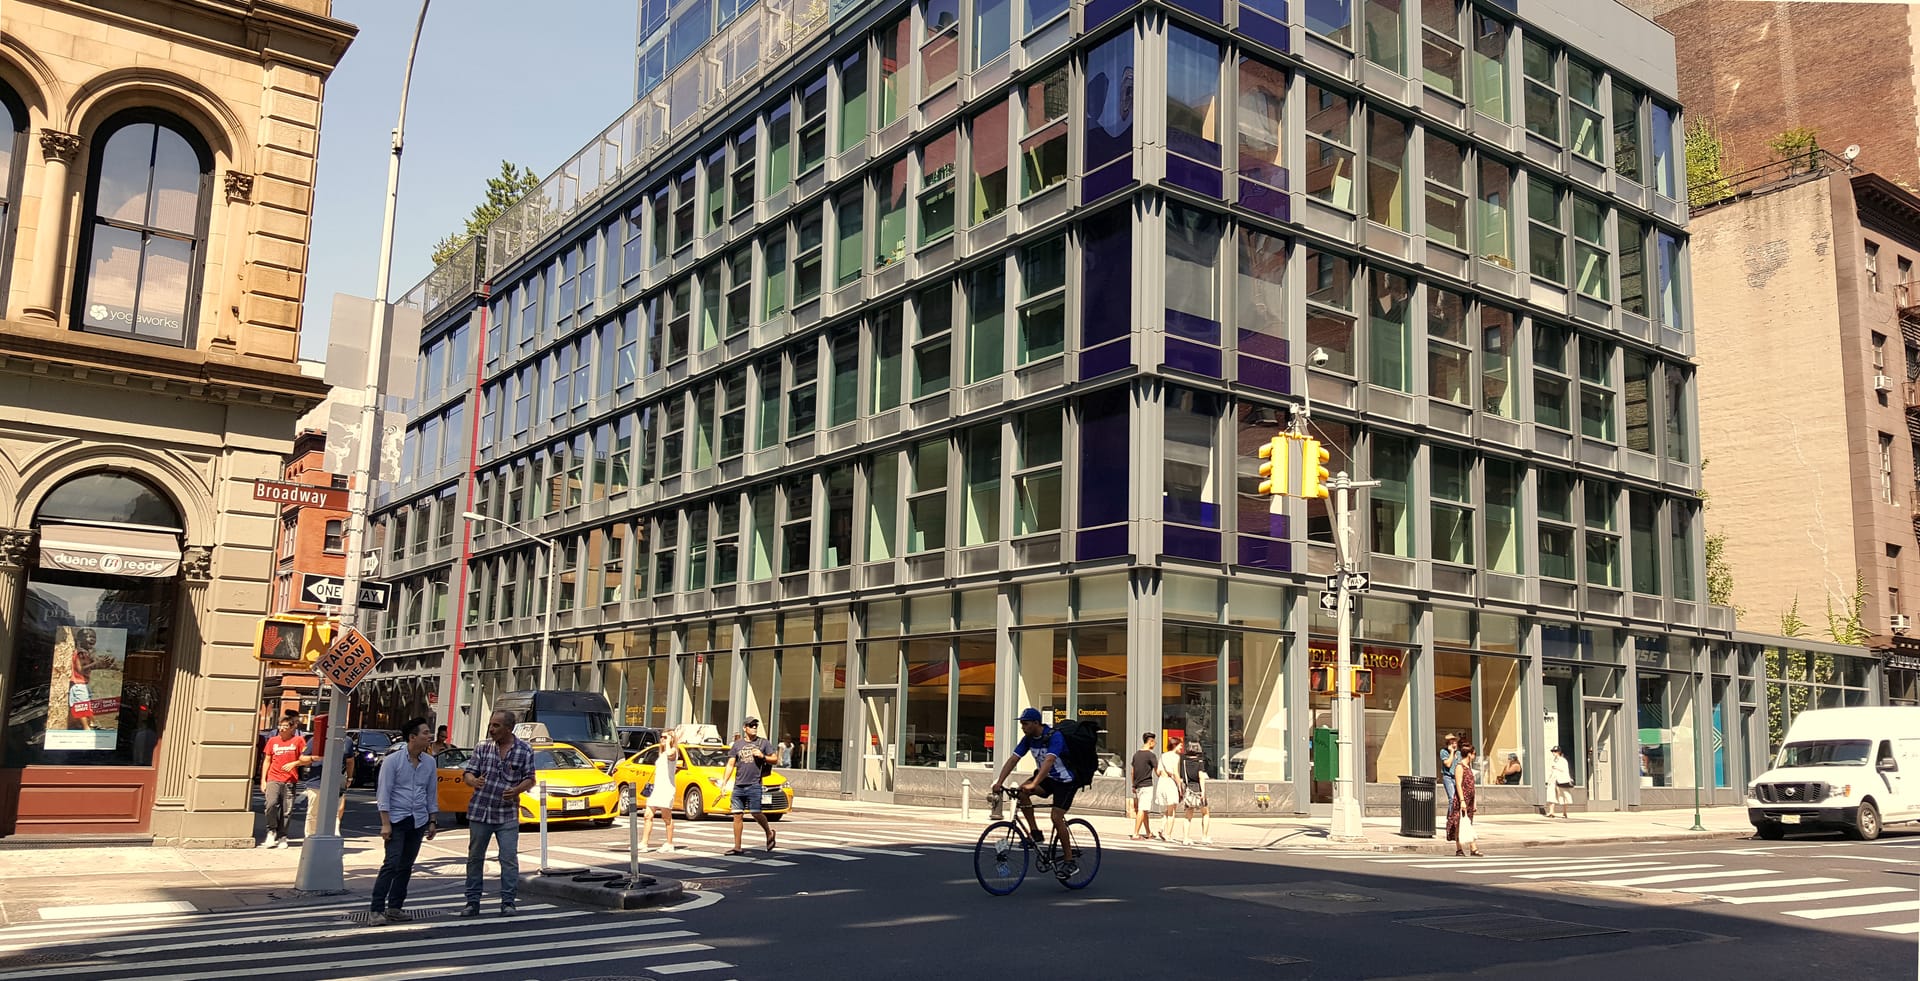
40 Mercer, completed in 2007, was Pritzker Prize laureate Jean Nouvel's first residential building in New York, and it treats the glass curtain wall as a work of color and light rather than a neutral skin. Nouvel wraps the block-through structure in a taut grid of floor-to-ceiling glass punctuated by ruby-red and cobalt-blue mullioned panes -- red along Mercer, blue turning the corner onto Broadway -- crowned by a deep-blue lattice 'lantern' that glows over the SoHo rooftops at dusk. The building's signature gesture is architectural theater: oversized panels up to seven by twelve feet that glide open electronically, dissolving the wall between the loft interior and the open air. Inside, eleven- to twelve-foot ceilings, teak-and-stainless kitchens and honed-marble baths continue Nouvel's language of restraint, letting the framed views of SoHo's cast-iron streetscape become the art on the wall.
Active, sold & rented
Nothing is publicly listed right now.
No residences currently for rent — .
| Closed | Residence | Price | $/SF | Bd / Ba | Sq ft | Rebate at price* | Plan | |
|---|---|---|---|---|---|---|---|---|
| Jul 2026 | $13,250,000 | $4,408 | 4 / 3.5 | 3,006 | $79,500 | Plan | ||
| May 2026 | $4,500,000 | $1,899 | 3 / 3.5 | 2,370 | $27,000 | Plan | ||
| Aug 2024 | $7,350,000 | $3,332 | 2 / 2.5 | 2,206 | $44,100 | Plan | ||
| Mar 2024 | $9,000,000 | $3,326 | 3 / 3.5 | 2,706 | $54,000 | Plan | ||
| Jul 2023 | $3,815,000 | $2,314 | 2 / 2 | 1,649 | $22,890 | Plan | ||
| May 2023 | $7,900,000 | $3,581 | 2 / 2.5 | 2,206 | $47,400 | Plan | ||
| Aug 2022 | $3,800,000 | $2,686 | — / — | 1,415 | $22,800 | — | ||
| Feb 2022 | $3,935,000 | $2,251 | 2 / 2.5 | 1,748 | $23,610 | Plan | ||
| Feb 2022 | $7,800,000 | $3,536 | 2 / 2.5 | 2,206 | $46,800 | Plan | ||
| Oct 2021 | $6,350,000 | $2,565 | — / — | 2,476 | $38,100 | — | ||
| Apr 2021 | $3,200,000 | $2,619 | 1 / 1.5 | 1,222 | — | |||
| Sep 2018 | $8,350,000 | $3,785 | 3 / 2.5 | 2,206 | $50,100 | Plan | ||
| Jul 2018 | $7,350,000 | $2,968 | — / — | 2,476 | $44,100 | — | ||
| Mar 2016 | $7,050,000 | $2,975 | 3 / 3.5 | 2,370 | $42,300 | Plan | ||
| Oct 2015 | $3,200,000 | $2,619 | 1 / 1.5 | 1,222 | Plan | |||
| Jun 2015 | $9,000,000 | $4,080 | 3 / 2.5 | 2,206 | $54,000 | Plan | ||
| Jan 2015 | $7,500,000 | $3,400 | — / — | 2,206 | $45,000 | — | ||
| Sep 2014 | $12,390,000 | $4,122 | 4 / 3.5 | 3,006 | $74,340 | Plan | ||
| Jul 2014 | $4,700,000 | $2,850 | — / — | 1,649 | $28,200 | — | ||
| Jun 2014 | $4,700,000 | $2,850 | — / — | 1,649 | $28,200 | — | ||
| Jun 2014 | $11,250,000 | $4,157 | 3 / 4 | 2,706 | $67,500 | — | ||
| May 2014 | $4,925,000 | $2,672 | — / — | 1,843 | $29,550 | — | ||
| Jan 2014 | $6,174,000 | $2,605 | 3 / 3.5 | 2,370 | $37,044 | Plan | ||
| Oct 2013 | $9,450,000 | $3,492 | 3 / 3.5 | 2,706 | $56,700 | Plan | ||
| Aug 2013 | $7,475,000 | $3,019 | 3 / 3 | 2,476 | $44,850 | — | ||
| Apr 2013 | $3,020,000 | $2,471 | — / — | 1,222 | — | |||
| Jan 2013 | $4,150,000 | $2,933 | — / — | 1,415 | $24,900 | — | ||
| Dec 2012 | $2,900,000 | $2,373 | — / — | 1,222 | — | |||
| Aug 2012 | $2,800,000 | $2,291 | 1 / 1.5 | 1,222 | — | |||
| Apr 2012 | $4,050,000 | $2,456 | — / — | 1,649 | $24,300 | — | ||
| Apr 2012 | $3,500,000 | $2,002 | 2 / 2.5 | 1,748 | Plan | |||
| Jan 2012 | $6,625,000 | $2,676 | — / — | 2,476 | $39,750 | — | ||
| Apr 2011 | $4,300,000 | $2,333 | — / — | 1,843 | $25,800 | — | ||
| Dec 2010 | $5,100,000 | $2,152 | — / — | 2,370 | $30,600 | — | ||
| Nov 2010 | $7,150,000 | $3,241 | 2 / 2.5 | 2,206 | $42,900 | Plan | ||
| Sep 2010 | $7,565,000 | $2,796 | — / — | 2,706 | $45,390 | — | ||
| Mar 2010 | $1,750,000 | $1,432 | — / — | 1,222 | — | |||
| Mar 2010 | $2,243,000 | $1,836 | 1 / 1.5 | 1,222 | Plan | |||
| Sep 2009 | $4,258,508 | $1,720 | — / — | 2,476 | $25,551 | — | ||
| Sep 2009 | $3,812,500 | $2,069 | — / — | 1,843 | $22,875 | — | ||
| Mar 2009 | $4,250,000 | $2,306 | — / — | 1,843 | $25,500 | — | ||
| Aug 2008 | $8,300,000 | $3,067 | 3 / 3.5 | 2,706 | $49,800 | Plan | ||
| Jul 2008 | $6,850,000 | $3,105 | 2 / 2.5 | 2,206 | $41,100 | Plan | ||
| Jul 2008 | $4,325,000 | $2,623 | — / — | 1,649 | $25,950 | — | ||
| May 2008 | $7,425,000 | $3,366 | 2 / 2.5 | 2,206 | $44,550 | Plan | ||
| Nov 2007 | $4,289,700 | $2,328 | — / — | 1,843 | $25,738 | — | ||
| Jul 2007 | First sale | $6,364,063 | $2,352 | — / — | 2,706 | $38,184 | — | |
| Jul 2007 | First sale | $5,371,269 | $2,435 | 2 / 2.5 | 2,206 | $32,228 | Plan | |
| Jul 2007 | First sale | $13,135,425 | $3,737 | — / — | 3,515 | $78,813 | — | |
| Jul 2007 | $865,513excluded from charts | — | — / — | 817 | — | |||
| Jun 2007 | First sale | $5,956,763 | $2,201 | — / — | 2,706 | $35,741 | — | |
| Jun 2007 | First sale | $4,989,425 | $2,262 | 2 / 2.5 | 2,206 | $29,937 | Plan | |
| Jun 2007 | First sale | $3,411,138 | $1,851 | — / — | 1,843 | — | ||
| Jun 2007 | First sale | $9,927,938 | $3,303 | 4 / 3.5 | 3,006 | $59,568 | Plan | |
| Jun 2007 | First sale | $6,924,100 | $2,559 | — / — | 2,706 | $41,545 | — | |
| Jun 2007 | First sale | $7,076,838 | $2,615 | 3 / 4 | 2,706 | $42,461 | — | |
| Jun 2007 | First sale | $8,247,825 | $3,902 | — / — | 2,114 | $49,487 | — | |
| May 2007 | First sale | $5,243,988 | $2,377 | — / — | 2,206 | $31,464 | — | |
| May 2007 | First sale | $5,447,638 | $2,469 | — / — | 2,206 | $32,686 | — | |
| May 2007 | First sale | $5,432,364 | $2,463 | 3 / 2.5 | 2,206 | $32,594 | Plan | |
| May 2007 | First sale | $2,672,906 | $2,187 | — / — | 1,222 | — | ||
| May 2007 | First sale | $12,728,125 | $3,075 | — / — | 4,139 | $76,369 | — | |
| May 2007 | First sale | $5,931,306 | $2,192 | 3 / 3.5 | 2,706 | $35,588 | Plan | |
| May 2007 | First sale | $2,800,188 | $1,648 | — / — | 1,699 | — | ||
| Apr 2007 | First sale | $3,640,244 | $1,975 | — / — | 1,843 | $21,841 | — | |
| Apr 2007 | First sale | $5,498,550 | $2,221 | — / — | 2,476 | $32,991 | — | |
| Apr 2007 | First sale | $4,582,125 | $1,851 | — / — | 2,476 | $27,493 | — | |
| Apr 2007 | First sale | $2,672,906 | $1,889 | — / — | 1,415 | — | ||
| Apr 2007 | First sale | $4,531,213 | $1,912 | 3 / 3.5 | 2,370 | $27,187 | Plan | |
| Apr 2007 | First sale | $2,698,363 | $1,544 | 2 / 2.5 | 1,748 | Plan | ||
| Apr 2007 | First sale | $3,436,594 | $2,084 | 2 / 2 | 1,649 | Plan | ||
| Apr 2007 | First sale | $3,767,525 | $2,285 | — / — | 1,649 | $22,605 | — | |
| Mar 2007 | First sale | $3,034,385 | $2,144 | — / — | 1,415 | — | ||
| Mar 2007 | First sale | $3,309,313 | $2,339 | — / — | 1,415 | — | ||
| Mar 2007 | First sale | $4,989,425 | $2,105 | 3 / 3.5 | 2,370 | $29,937 | Plan | |
| Mar 2007 | First sale | $3,309,313 | $2,007 | — / — | 1,649 | — | ||
| Mar 2007 | First sale | $5,040,338 | $2,036 | — / — | 2,476 | $30,242 | — | |
| Mar 2007 | First sale | $5,223,623 | $2,110 | 3 / 3 | 2,476 | $31,342 | — | |
| Mar 2007 | First sale | $4,709,406 | $1,987 | — / — | 2,370 | $28,256 | — | |
| Mar 2007 | First sale | $4,174,825 | $1,762 | 3 / 3.5 | 2,370 | $25,049 | Plan | |
| Mar 2007 | First sale | $2,800,188 | $1,979 | — / — | 1,415 | — | ||
| Mar 2007 | First sale | $3,003,838 | $1,822 | — / — | 1,649 | — | ||
| Mar 2007 | First sale | $2,291,063 | $1,875 | 1 / 1.5 | 1,222 | — | ||
| Mar 2007 | First sale | $2,392,888 | $1,958 | — / — | 1,222 | — | ||
| Mar 2007 | First sale | $2,800,188 | $2,291 | 1 / 1.5 | 1,222 | Plan | ||
| Mar 2007 | First sale | $3,563,875 | $1,934 | — / — | 1,843 | $21,383 | — | |
| Mar 2007 | First sale | $4,241,011 | $2,301 | — / — | 1,843 | $25,446 | — |
Every deed recorded in NYC ACRIS for the residential lots — actual closing prices, not asking prices. "Rebate at this price" is an illustrative estimate at that price under the current rebate terms; eligibility conditions apply.*
| Leased | Residence | Rent | $/SF/yr | Bd / Ba | Sq ft | Plan | |
|---|---|---|---|---|---|---|---|
| Aug 2025 | $18,000/mo | $117 | — / — | 1,843 | — | ||
| May 2024 | Furnished | $11,995/mo | $118 | — / — | 1,222 | — | |
| Apr 2024 | $22,500/mo | $109 | — / — | 2,476 | — | ||
| Mar 2024 | $15,000/mo | $127 | — / — | 1,415 | — | ||
| May 2023 | $11,500/mo | $113 | — / — | 1,222 | — | ||
| Mar 2023 | Furnished | $14,000/mo | $102 | 2 / 2 | 1,649 | Plan | |
| Mar 2023 | $23,000/mo | $111 | — / — | 2,476 | — | ||
| Feb 2023 | $24,500/mo | $124 | 3 / 3.5 | 2,370 | Plan | ||
| Nov 2022 | Furnished | $35,000/mo | $155 | — / — | 2,706 | — | |
| Oct 2022 | Furnished | $30,000/mo | $133 | 3 / 3.5 | 2,706 | Plan | |
| May 2022 | $18,000/mo | $124 | 2 / 2.5 | 1,748 | Plan | ||
| Feb 2022 | Furnished | $11,500/mo | $113 | — / — | 1,222 | — | |
| Oct 2021 | $13,000/mo | $110 | — / — | 1,415 | — | ||
| Sep 2021 | $14,500/mo | $94 | — / — | 1,843 | — | ||
| Jul 2021 | Furnished | $45,000/mo | $180 | 4 / 3.5 | 3,006 | Plan | |
| Jun 2021 | $22,500/mo | $114 | 3 / 3.5 | 2,370 | Plan | ||
| May 2021 | $25,000/mo | $121 | — / — | 2,476 | — | ||
| Feb 2021 | Furnished | $22,000/mo | $98 | 3 / 3.5 | 2,706 | Plan | |
| Feb 2021 | Furnished | $17,000/mo | $92 | 2 / 2.5 | 2,206 | Plan | |
| Feb 2021 | $10,500/mo | $89 | — / — | 1,415 | — | ||
| Jan 2021 | Furnished | $18,000/mo | $131 | 2 / 2 | 1,649 | Plan | |
| Dec 2019 | $20,000/mo | $101 | 3 / 3.5 | 2,370 | Plan | ||
| Aug 2019 | $14,500/mo | $123 | — / — | 1,415 | — | ||
| Jul 2019 | $18,000/mo | $124 | 2 / 2.5 | 1,748 | Plan | ||
| May 2018 | $9,500/mo | $93 | — / — | 1,222 | — | ||
| Apr 2018 | $23,000/mo | $125 | 2 / 2.5 | 2,206 | Plan | ||
| Mar 2018 | $15,500/mo | $101 | — / — | 1,843 | — | ||
| Oct 2017 | $15,500/mo | $131 | — / — | 1,415 | — | ||
| Sep 2017 | $23,000/mo | $111 | — / — | 2,476 | — | ||
| Jul 2017 | $12,500/mo | $106 | — / — | 1,415 | — | ||
| Jul 2017 | $12,500/mo | $123 | 1 / 1.5 | 1,222 | — | ||
| Jun 2017 | $13,500/mo | $114 | — / — | 1,415 | — | ||
| Jan 2017 | Furnished | $25,000/mo | $136 | 3 / 2.5 | 2,206 | Plan | |
| Oct 2016 | $25,000/mo | $127 | 3 / 3.5 | 2,370 | Plan | ||
| Sep 2016 | $27,000/mo | $131 | — / — | 2,476 | — | ||
| Aug 2015 | $13,000/mo | $128 | 1 / 1.5 | 1,222 | — | ||
| Jun 2015 | $15,000/mo | $127 | — / — | 1,415 | — | ||
| May 2015 | Furnished | $38,000/mo | $169 | 3 / 3.5 | 2,706 | Plan | |
| Dec 2013 | $14,500/mo | $123 | — / — | 1,415 | — | ||
| May 2013 | $34,950/mo | $169 | — / — | 2,476 | — | ||
| Oct 2012 | $35,000/mo | $170 | — / — | 2,476 | — | ||
| Mar 2012 | $13,500/mo | $114 | — / — | 1,415 | — |
Closed leases reported to the REBNY Listing Service — what tenants paid.
Every closing since 2007
Deeds recorded with the City of New York — actual closing prices, never asking prices.
Highest annual average: $3,377/SF in 2018. 2026 to date: $3,153/SF across 2 closings. Annual averages swing with the mix — a penthouse year reads high.
Of the 41 closings in 2007, 40 were each residence's first recorded sale and 1 was an early resale; since 2008 the building has recorded 0–6 closings a year.
86 closings plotted, from $1.75M to $13.3M. Larger residences generally trade higher.
Lowest: Residence 9, 1,222 sf, $1,750,000 (Mar 2010). Highest: Residence 30, 4-bed, 3,006 sf, $13,250,000 (Jul 2026). Lowest and highest figures use arm's-length, single-residence deeds within the $/SF band below.
Source: NYC ACRIS recorded deeds for the 41 residential condominium lots, matched to DOF gross square feet. 86 closings charted. Not counted at all: 20 further deeds recorded with $0 consideration (outside the 87 priced deeds). Excluded from the charts: 14 (Jul 2007) — bought by the condominium's own board of managers — not an arm's-length sale. Rules: deeds under $250K are treated as non-market transfers; a $/SF more than 3× or under 40% of the median of deeds within a year either side (or the building median, $2,352/SF, where that window is thin) is treated as an outlier; deeds to the condominium's own board of managers are not market sales.
The year-by-year record
| Year | Closings | Avg $/SF | Median $/SF | Avg price | Total volume |
|---|---|---|---|---|---|
| 2026 | 2 | $3,153 | $3,153 | $8.88M | $17.8M |
| 2025 | 0 | — | — | — | — |
| 2024 | 2 | $3,329 | $3,329 | $8.18M | $16.4M |
| 2023 | 2 | $2,947 | $2,947 | $5.86M | $11.7M |
| 2022 | 3 | $2,824 | $2,686 | $5.18M | $15.5M |
| 2021 | 2 | $2,592 | $2,592 | $4.78M | $9.55M |
| 2020 | 0 | — | — | — | — |
| 2019 | 0 | — | — | — | — |
| 2018 | 2 | $3,377 | $3,377 | $7.85M | $15.7M |
| 2017 | 0 | — | — | — | — |
| 2016 | 1 | $2,975 | $2,975 | $7.05M | $7.05M |
| 2015 | 3 | $3,366 | $3,400 | $6.57M | $19.7M |
| 2014 | 6 | $3,209 | $2,850 | $7.36M | $44.1M |
| 2013 | 4 | $2,979 | $2,976 | $6.02M | $24.1M |
| 2012 | 5 | $2,360 | $2,373 | $3.98M | $19.9M |
| 2011 | 1 | $2,333 | $2,333 | $4.3M | $4.3M |
| 2010 | 5 | $2,291 | $2,152 | $4.76M | $23.8M |
| 2009 | 3 | $2,032 | $2,069 | $4.11M | $12.3M |
| 2008 | 4 | $3,040 | $3,086 | $6.72M | $26.9M |
| 2007 | 41 | $2,253 | $2,187 | $4.92M | $201.7M |
Download the full sales history: 40-mercer-street-sales.csv (87 recorded sales, NYC ACRIS).
All 41 residences, floor by floor
41 residential lots on the NYC Department of Finance roll (block 474), drawn to relative size. Sales: ACRIS recorded deeds. Layouts, listings and floor plans: REBNY Listing Service. Floors without residences (amenity / mechanical levels) are omitted.
Facts & amenities
- Architect
- Jean Nouvel
- Developer
- Andre Balazs Properties with Hines
- Completed
- 2007
- Floors
- 13
- Residential units
- 41 (DOF roll)
- Unit mix
- One- to four-bedroom residences of roughly 817 to 4,139 sq ft, plus two penthouses with private plunge pools
- Neighborhood
- SoHo
- Tax lot
- Manhattan block 474, lots 1501–1547
- Coordinates
- 40.721215, -74.000954
- 24-hour white-glove concierge and attended lobby
- Live-in resident manager
- M40 spa club with 50-foot T-shaped Carrara-marble lap pool
- 12-person Jacuzzi, steam room and sauna
- State-of-the-art fitness center
- Landscaped courtyard and 7th-floor sky garden
- Underground valet parking with direct building access
- Private storage
- Residents' lounge and event space
Explore the neighborhood
Transit
- N/Q/R/W/J/Z/6 at Canal Street (~2 blocks)
- N/R/W at Prince Street
- 6 at Spring Street
- B/D/F/M at Broadway-Lafayette Street
- A/C/E at Canal Street
Dining & culture
Step out the door to flagship boutiques along Broadway, Prince and Greene Streets -- Prada, Chanel, Dior -- and the galleries that define downtown style. Dining runs from Balthazar and Lure Fishbar to the cafes of adjacent Nolita, with gourmet markets minutes away.
40 Mercer Street: questions & answers
What apartments are for sale at 40 Mercer Street right now?
As of Oct 2026, no residence is publicly listed for sale at 40 Mercer Street. Conquest tracks every unit and can tell you the moment one lists, then arrange a private showing and represent you as the buyer; eligible new clients may receive 20% of Conquest's buyer-side commission back on purchases over $3.5M.*
How do I tour apartments at 40 Mercer Street?
Conquest arranges private showings of every available residence at 40 Mercer Street. WhatsApp +1 (201) 228-4688, call (646) 480-6095, or send the inquiry form on this page.
Who can help me buy at 40 Mercer Street?
Conquest represents buyers at 40 Mercer Street with building-specific data: 86 recorded sales since 2007 and a median of $3,153 per square foot over the 24 months ending October 27, 2026. Eligible new clients may receive 20% of Conquest's buyer-side commission back on purchases over $3.5M.*
How many residences are in 40 Mercer Street?
40 Mercer Street has 41 residential condominium units on the NYC Department of Finance assessment roll as of Oct 2026 (Manhattan block 474, lots 1501–1547). Source: NYC DOF roll.
Who designed 40 Mercer Street and how tall is it?
40 Mercer Street, known as 40 Mercer Residences, was designed by Jean Nouvel, was completed in 2007 and rises 13 floors. It was developed by Andre Balazs Properties with Hines. Source: Conquest building file.
Is 40 Mercer Street a condominium?
Yes. Each of the 41 residences is a separate condominium tax lot on the NYC DOF roll and is bought and sold by recorded deed; 87 priced deeds have been recorded since 2007. Source: NYC DOF roll, NYC ACRIS recorded deeds.
What is the price per square foot at 40 Mercer Street?
The median recorded sale over the 24 months ending October 27, 2026 was $3,153 per square foot across 2 closings, up 44% from the 2007 median of $2,187 per square foot. Source: NYC ACRIS recorded deeds and NYC DOF square footage.
What is the highest price ever paid at 40 Mercer Street?
The highest recorded sale is Residence 30 at $13,250,000, closed in Jul 2026 ($4,408 per square foot). Source: NYC ACRIS recorded deeds, as of Oct 2026.
How many apartments sold at 40 Mercer Street in the last 12 months?
2 sales were recorded in the 12 months ending October 27, 2026, ranging from $4,500,000 to $13,250,000. Source: NYC ACRIS recorded deeds.
What do apartments at 40 Mercer Street rent for?
1 lease was signed in the 24 months ending October 27, 2026, at a median of $18,000 per month (range $18,000 to $18,000). Source: REBNY RLS closed leases.
How many apartments were rented at 40 Mercer Street in the last 12 months?
No leases were signed in the 12 months ending October 27, 2026; 42 closed leases are on record in total. Source: REBNY RLS.
What neighborhood is 40 Mercer Street in and what is the nearest subway?
40 Mercer Street is in SoHo, Manhattan (ZIP 10013). The nearest subway is the N/Q/R/W/J/Z/6 at Canal Street (~2 blocks). Source: Conquest building file.
How does the Conquest buyer rebate work at 40 Mercer Street?
Conquest rebates 20% of its buyer-side commission to new clients on purchases (not rentals) over $3,500,000 with non-exclusive buyer representation, provided the rebate is requested in writing before the first showing; at an assumed 3% commission that is 0.6% of the price. At the building's median recorded sale price over the 24 months ending October 27, 2026, $8,875,000, the estimated rebate is $53,250. Actual commission and rebate depend on the transaction.
Thinking of selling?
Get a private valuation built from every recorded closing in the building — 86 ACRIS sales, median $3,153/SF over the last two years — plus what listed comparables are asking today.